Generals Always Fight the Last War
How the 2020 Election is Different from 2016
How I learned to trust the polls again and why you should too.
TL;DR
A two candidate race means the polls only have to get one candidate correct. The 2016 race was a four-plus candidate race where the polls were often wrong for three of the four candidates.
The five states that the polls missed never had Clinton above 50 percent and averaged an accuracy less than a percent within Clinton's election day results. The same five states that forecasters missed, including myself, incorrectly set probabilities that are only accurate for a candidate to be above 50 percent.
What I will cover in this post
- Why polls are more accurate for two candidates
- How the polls were wrong in 2016
- Why the forecasts were wrong in 2016
Two candidates means one will win a majority
Let us start with the simple definition of a majority; more than half. If a candidate has more than half the votes, it is mathematically impossible for them to lose. The easy way to think of this is to imagine a pie

The candidate with the larger slice wins. When a candidate has more than half, they have the largest slice regardless of what that percentage may be.
If you are correct in how much pie was removed, you can figure out how much is left. If you are correct in how much is left, you can figure out how much was taken. This is difference number 1: polls only need to be correct about one candidate.
The five states the polls got wrong
We know the story by now. 77,000 votes decided the 2016 election. Florida and North Carolina were close, but Pennsylvania, Michigan, and Wisconsin were polling that they would be blue on election night. At least that is the story, but when we look back at 2016, that was not necessarily the case.
North Carolina: 15 Electoral College Votes

There are a few things to highlight when we look at the final polls leading up to election night. The first obvious one is that both major party candidates were in the lead, yet only Trump had a majority. The second one is that the Trump leads were closer to a majority than the Clinton leads.

When we look at the three candidate race polling averages and final results, we see that Johnson polled much higher than he actually performed. 1.5% may not seem like much, but we have to consider that is 50% higher than his final results. Clinton performed 0.7% better than she was polling. Finally, we see Trump ended at 49.9%. Again, the various polls showed when he was in the lead, he was closest to 50%. Even if we took a simple average of the last polls, we had Trump winning North Carolina.
Florida: 29 Electoral College Votes

Florida has been at the center of presidential elections since 2000. The polls for 2016 showed a very close race with a similar pattern we see with North Carolina. Of note, we only saw Trump reach a 50% majority in Florida. The highest we see Clinton is at 49%.

Florida had four major candidates on the ballot. Similar to North Carolina, the third party candidates polled higher on average than their final results. Clinton's polling average was a percentage point higher than her final result while Trump's was 2 percentage points.
In two close races, we have seen how the averages for third party candidates were much higher than the final results. Clinton's averages were at most 1 percentage point lower than her final results while Trump's were at least 2 percentage points lower than his final results.
Two close races could be overlooked, but the 2016 narrative is how the polls were "wrong" in three states.
Pennsylvania: 20 Electoral College Votes

At first glance, knowing that Trump won the state makes it look like the polls were in fact very wrong. Keeping in mind that a majority is at least 50%, the highest we see Clinton is at 49%. We could also highlight that the highest we see Trump polling at is 46%. Note that when he does poll at 46%, it is either a tie or Clinton is ahead of him but 1 percentage point. When we bring in the third party candidates, what the polls got wrong becomes rather obvious.

Yet again we see the third party effect on polling averages. Stein, the Green Party candidate and favored by progressives, averaged nearly double her final results. When we look at the Clinton's results, we see her polling average was below her final results. Johnson and Trump's polling averages and final results have a similar relationship.
Trump's gap between his final results and polling average are the largest of the four candidates. None of the final polls had Trump at 48%. Here we start to see the second difference between the 2016 and 2020 elections.
If we add up the polling averages of the four candidates, we do not end up with 100%.
46.2 + 44.3 + 3.0 + 1.5 = 95We are left with 5% of votes to distribute. These are the undecided voters polls could not place and ultimately determined the results for Pennsylvania.
Michigan: 16 Electoral College Votes

In Michigan, we see the same trend for Trump we had in Pennsylvania. For Clinton, we have two polls that place her at 50%. What is important to highlight here are the sample sizes of the two polls that placed her at 50%. The smaller the sample size, the larger the margin of error.

We see the same pattern again with the third party candidates polling averages higher than their final results. Once again, when we add up the polling averages of the four candidates, we do not end up with 100%.
45.4 + 42.0 + 4.8 + 2.3 = 94.5Michigan had 5.5% of undecided voters not appear in the polls yet determined the results for Michigan.
Wisconsin: 10 Electoral College Votes

Wisconsin is another state where Trump did not have a lead in the polls. If we look at the polls with the largest sample size, Clinton received 46% in all three polls.

The polling average for Clinton is the closest to her final results we have seen thus far. Once again, we see the third party candidates averaging nearly double their final results. And yet again, when we add up the polling averages, we are still under 100%
46.8 + 40.3 + 5.8 + 2.0 = 94.9Wisonsin had 5.1% of undecided voters not appear in the polls. Those voters combined with half the Johnson polling average would give us close to Trump's final result.
How the polls were wrong
- Polling averages were higher for third party candidates and lower for the main candidates.
- Stein took polling points from Clinton and Johnson took polling points from Trump.
- The larger the sample size, the closer the poll result was to the final result for Clinton.
- About 5% of voters were not captured in polls and they determined the winners of several states.
Difference number 2: there are two main candidates.
Forecast Error: Garbage in, Garbage out

Most forecasters, including myself, had the 2016 election outcome at around 322 for Clinton and 216 for Trump. Missing five states changed the forecasted result and which candidate crossed 270 to win.
NC + FL + PA + MI + WI = 90
15 + 29 + 20 + 16 + 10 = 90216 + 90 = 306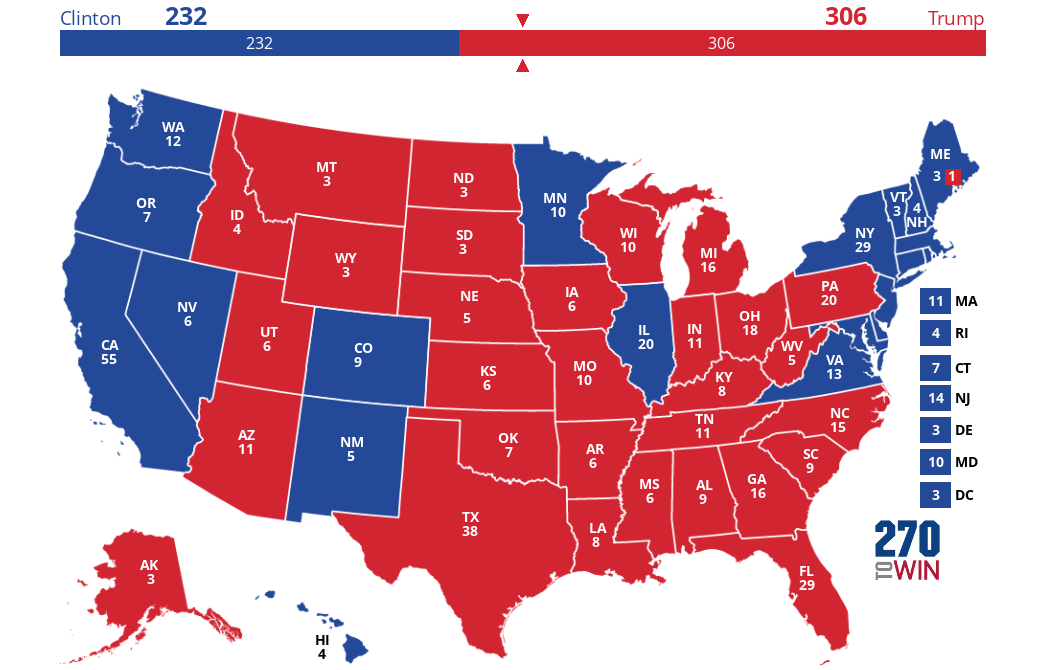
Forecasters have a two-step process in order to determine who is most likely to win an election. The first step involves turning polling data into probabilities. The second step involves calculating those probabilities into combinations of states to achieve 270 or more electoral college votes.
Getting the state probabilities wrong
In a two candidate race, the probability either candidate will win is 50%, just like a coin toss. This is known as the theoretical probability. In theory, either of the two has a chance of winning.
We know in reality, this is not the case. The reddest state will not turn blue, nor will the bluest state turn red. If such a dramatic shift were to occur, there are some signs we would see before the presidential election. The number of representatives and senators in Congress as well as governors that belong to one party or the other would be several signs. Another is state polling data.
Instead of a normal, flat coin, we have a bent coin. We flip it 10 times and it comes up heads 7 times. By experimenting, we determined heads will come up 70% of the time. This is known as the experimental probability.

Every forecaster handles polling data slightly differently. Some weight it by date, others by sample size, and some by which firm conducted the poll. In all cases, a forecast is left with an estimate for a percentage of votes each candidate will win. As I mentioned at the onset, an undisputed win by simple majority, regardless of the number of candidates in a race, is more than half.
Bent coins and shaved dice
The coin toss analogy only works for two candidates. When we have four on a ballot, what we have is closer to dice. The theoretical probability would be that each candidate has a 25% chance of winning a state. But polling data was correct in showing that only two candidates were likely to win. We don't have fair dice in this scenario, we have shaved dice with two sides more likely to land.

We knew there were more than two candidates on most state ballots. We know that the Johnson votes took away from Trump and the Stein votes took away from Clinton. From looking at the polling averages, they consistently showed that around 5% of voters were unaccounted for. If forecasts corrected for that 5% and the third party candidates, then the state probabilities would have shown more states closer to 50% probability for the two main candidates; a fair coin toss.
Five bad state probabilities to determine a winner
The second process forecasters do is to take the state probabilities and run simulations to see which candidate comes up with 270 or more electoral college votes. This is the same as flipping 51 bent coins at once and counting the number of heads or tails. Each coin would have different point totals to represent each states' electoral college votes. Doing this by computer means you can do this thousands of times to get a variety of outcomes.
Here are the probabilities I had for my forecast:
- North Carolina: 62.9% probability Clinton
- Florida: 70.3% probability Clinton
- Pennsylvania: 85.9% probability Clinton
- Michigan: 86.8% probability Clinton
- Wisconsin: 90.2% probability Clinton
Here are the probabilities Nate Silver of 538 had for his forecast:
- North Carolina: 54.9% probability Clinton
- Florida: 54.6% probability Clinton
- Pennsylvania: 77.4% probability Clinton
- Michigan: 80.3% probability Clinton
- Wisconsin: 84.1% probability Clinton
North Carolina and Florida combined are 34 electoral college votes. Bringing these close to coin toss probability is why Nate Silver had 28.2% probability of Trump achieving 270 or more electoral college votes. Regardless of the higher probability for a Trump victory, there were no adjustments to correct for Pennsylvania, Michigan, and Wisconsin.

All forecasters calculated probabilities for a two-candidate "coin toss" race when 2016 was a five candidate race between Clinton, Johnson, McMullin, Trump, and Stein.

In a two candidate race, only one poll has to be correct since what is left over is the other candidate's share of the pie. In a race of three or more, every slice of the pie has to be correct to determine which one is the larger slice.
Difference number 3: forecasters are correctly assigning probabilities for a bent coin toss.
The 2020 Election
Overcorrection for 2016, whether in polling or forecasts, is tantamount to fighting the last war. Healthy skepticism is good, but the key word is healthy. Excessive skepticism enters conspiratorial thinking. People do not trust the 2020 polling today because they trusted media interpretations and criticisms of the 2016 polls for only five states. Will California become a red state or Wyoming a blue state? No, not this year. Anyone who can not say that as a certainty probably had their confidence in polling shattered. Math has not changed since 2016, but the confidence in polls has dropped.
How is the 2020 election is different from 2016?
- Polls only need to be correct about one candidate
- There are two main candidates
- Forecasters are correctly assigning probabilities for a bent coin toss
Three simple questions to ask when reading the polls.
- Do the candidate percentages add up to 100%?
- Is one candidate over 50%?
- If all of the undecided votes go to one candidate, does that change who is in the lead?
Hopefully this helped bring some confidence back into understanding the polls, why there were errors in 2016, how they were amplified in forecasts, and why the 2020 election is different. I am one person making several forecasts based on different scenarios. Look at others and how they are coming to their conclusions. I try to be as transparent as possible with my analysis and would recommend reading others that are as well.
You can find my election updates at the link below:
Understanding the 2020 Presidential Election Polls